Case Study · Sugarcane Procurement Catchment

The Number We Refused to Ship

Every serious buyer of an AI product eventually asks the same question: what happens when the model is wrong? Most vendors don't have a good answer. This is the story of how FarmOptima caught a 2.5× measurement error, diagnosed why it happened, and corrected it — before a sugarcane mill ever saw the number.
ClientSugarcane Mill
GeographyMonsoon-Belt Catchment
Data SourcesRadar + Optical Satellite
Correction Applied> 2.5×
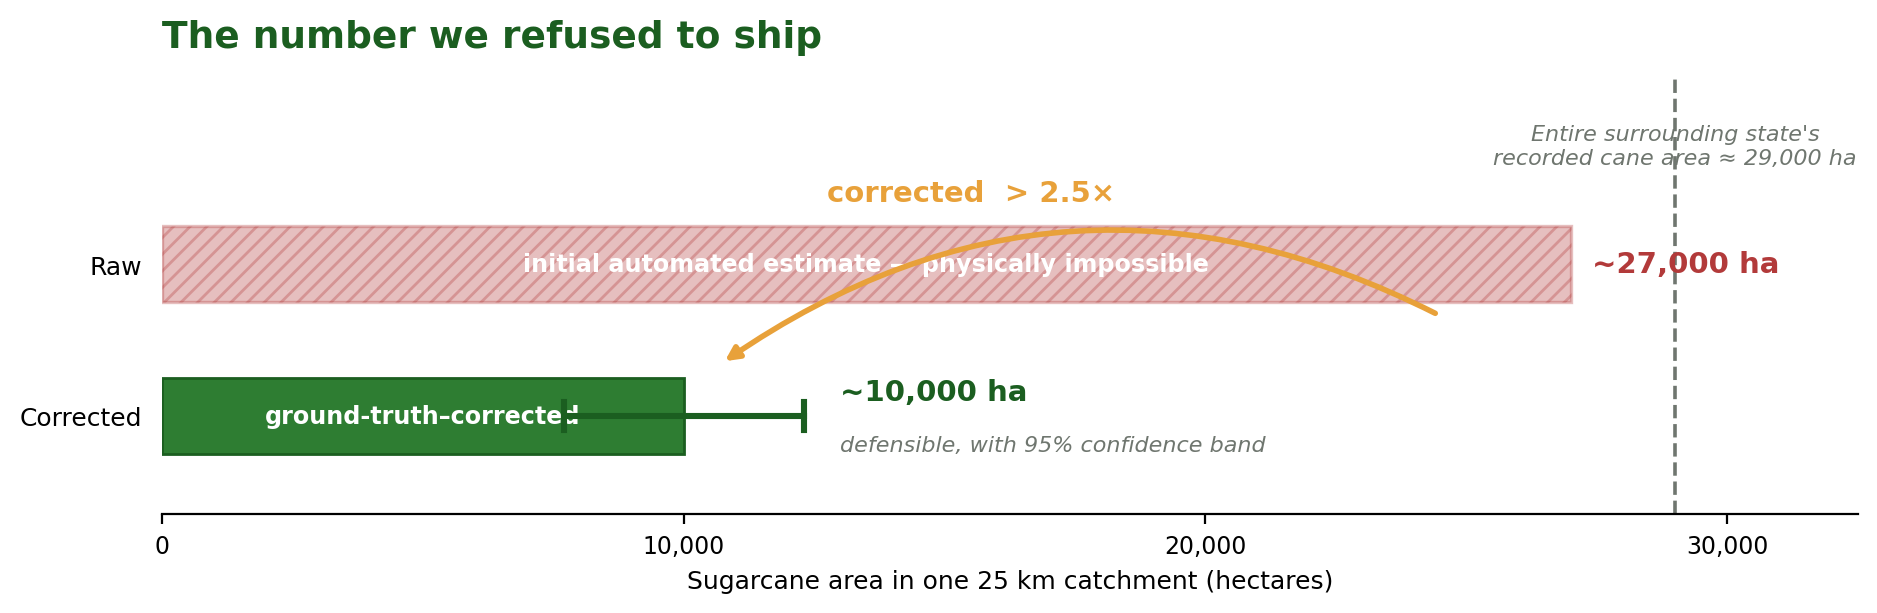
Chart: raw automated sugarcane area estimate of ~27,000 hectares corrected down to ~10,000 hectares
CORRECTION APPLIED > 2.5× down
Outcome 01 · First Pass
~27,000
Hectares implied by the raw automated estimate — more cane than the entire surrounding state is known to grow
⚠ Flagged before it shipped
Outcome 02 · Corrected
~10,000
Hectares after ground-truth correction, delivered with an explicit 95% confidence band
✓ Defensible & shipped
Outcome 03 · Method
>2.5×
De-biased using a stratified reference estimator against an independently verified sample
Peer-reviewed standard
The Opportunity

Agriculture Runs on Figures
Nobody Can Trust

Across smallholder geographies, the organisations that most need to know how much of a crop is growing — mills and processors, lenders, crop insurers, governments — run on numbers that were never actually measured.

❗ The Problem

Procurement plans, crop loans, and subsidy allocations rest on manual surveys and administrative estimates that routinely disagree with each other by wide margins and are almost never ground-truthed against reality. In monsoon-belt regions the gap is worse: dense cloud cover blinds conventional optical satellites for months of the growing season — precisely the months that matter.

🎯 The Engagement

A sugarcane mill needed a figure it could actually act on — how much cane was growing within its procurement catchment. Its own field team's estimate and the local authority's estimate were far apart, and the mill trusted neither. It needed an independent measurement rigorous enough to base real money on.

📐

The Measurement-and-Decision Layer for Data-Dark Agriculture

That is the market FarmOptima was built for: the areas with the most smallholders, the most fragmented land, and the highest need for reliable data are the ones where reliable data is hardest to produce.


The Approach

Seeing Through Cloud,
Isolating the Signal

FarmOptima combined radar and optical satellite imagery across a full crop year to build a measurement that would hold up under scrutiny.

Step 1 · Data Fusion
Radar + Optical Across a Full Crop Year
Radar was the key: because it sees straight through cloud, it carried the crop-growth signal through the entire monsoon, when optical imagery was unusable.
Step 2 · Signature Modeling
Separating Cane from Rice and Other Crops
Sugarcane's long, distinctive multi-month growth signature let the system separate it from surrounding crops across the catchment.
Step 3 · Masking
Stripping Out Everything That Isn't Cropland
Terrain and land-cover modelling removed hills, forest, water, and built-up land so that only genuine cropland was ever considered.
Step 4 · The Catch
A Physically Impossible First Pass
A machine-learning classifier, trained on real field observations, mapped the crop across the catchment — and the first automated pass returned a number that was physically impossible.

The Hero of This Case Study

The Pipeline Caught
Its Own Mistake

A less rigorous pipeline would have shipped it. A polished report with an impressive-looking "93% accuracy" attached would have gone out the door — and collapsed the moment anyone who knew the region read it. Ours flagged it instead, and then diagnosed why, which is the part that matters.

Bar chart comparing the raw sugarcane area estimate of approximately 27,000 hectares against the state's entire recorded cane area of approximately 29,000 hectares, and the ground-truth-corrected estimate of approximately 10,000 hectares with a 95% confidence band.
The first automated pass implied more sugarcane in one 25 km procurement catchment than the entire surrounding state is known to grow. The correction brought the number down by more than 2.5×, delivered with explicit confidence bounds rather than false precision.
Ground-truth verified
⚠️

Why the Model Looked Right and Was Wrong

The classifier scored 93% on its balanced test data, but that number was measuring the wrong thing. Sugarcane is a small minority of the real landscape, and a model that looks 93% accurate on a balanced sample can be badly imprecise when deployed on ground where the target is rare. The headline accuracy was real; it just didn't mean what a raw reading suggested. The process was built to know the difference.

🔬

How the Correction Was Made

Not a retune-until-it-looks-right exercise. FarmOptima drew an independent, random reference sample across the catchment, had each point verified against reality, and applied a stratified reference estimator — the peer-reviewed standard for defensible area estimation — to de-bias the raw count against measured ground truth.

The output is not the model's opinion — it is an estimate anchored to independently verified ground truth, with its uncertainty stated honestly.
That is the difference between a number you can demo and a number a mill, a bank, or an insurer can act on
Beyond the Number

From Measurement
to Decisions

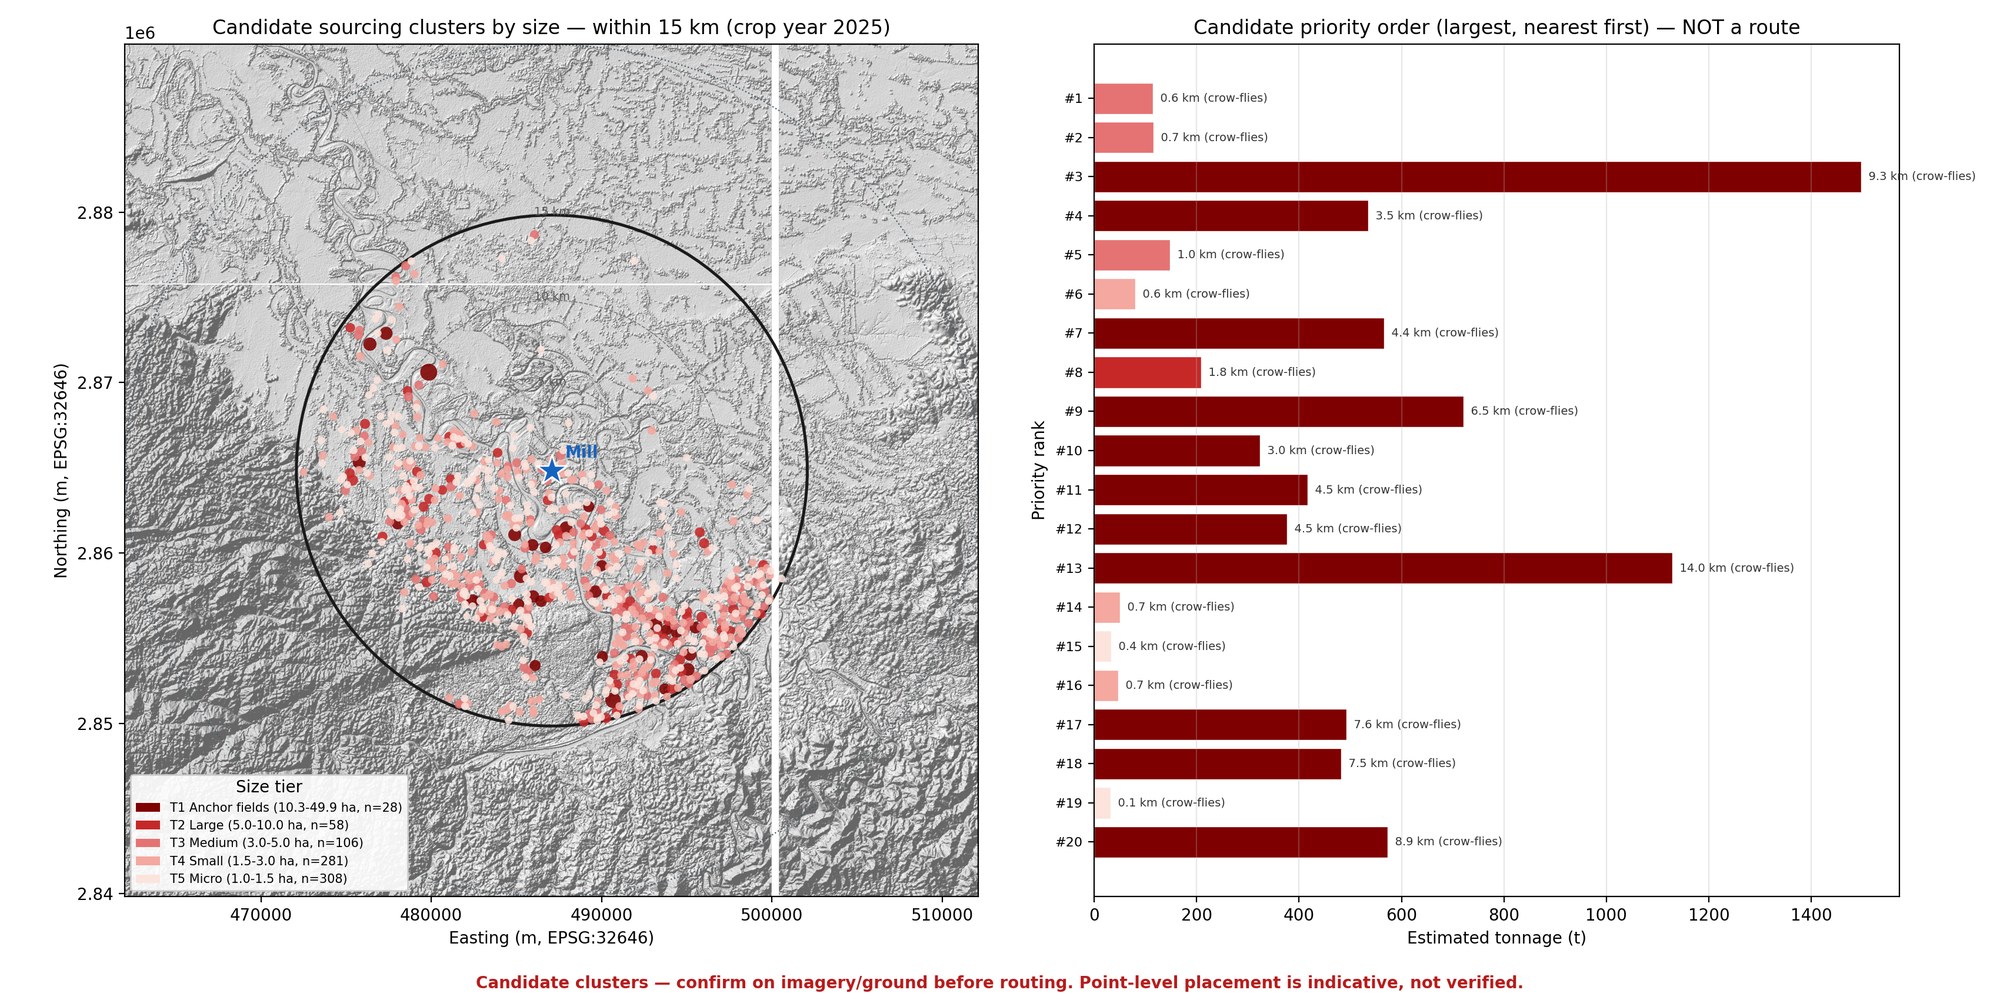
A defensible number is the foundation, not the product. The same pipeline converted the measurement into action: it identified the highest-value fields within the catchment, ranked them by size and haul distance into a priority order, and — crucially — put each targeted field through the same verification discipline before it was handed over, so operators were never sent to chase a field that wasn't there. The measurement became a route, a supplier strategy, and a season-over-season monitoring capability.

Left: map of candidate sugarcane sourcing clusters within a 15 km radius of the mill, color-coded by size tier from T1 anchor fields down to T5 micro-plots. Right: bar chart ranking the top 20 candidate clusters by priority — largest and nearest first — showing estimated tonnage and crow-flies distance for each, labeled 'not a route'.
Twenty candidate clusters ranked by size and priority within a 15 km radius — from a ~1,500-tonne anchor field 9.3 km out to micro-plots under a kilometre from the mill gate. This is a priority order, not a route: every candidate still goes through ground or imagery verification before a single truck is scheduled.
Confirm before routing

Why This Matters

A Category Crowded with Claims.
One Discipline That Isn't.

🛰️
A Defensible Data Layer for a Data-Dark, High-Value Market
Decision-grade measurement where none existed — the input that procurement, lending, insurance, and policy all depend on and none can currently trust.
🔁
Repeatable and Productised
The same pipeline re-runs every season on a consistent, comparable basis, and extends naturally from one catchment to a region — recurring by design, land-and-expand by default.
🧩
Hard to Replicate
The moat is not a single model. It is the integrated loop — earth-observation data science, agronomy, field operations, and statistical rigor — that turns raw imagery into a number that survives scrutiny.
🏦
Multiple Buyers for the Same Capability
Mills and processors, agricultural lenders, crop insurers, input companies, and governments all need the same underlying measurement.

Share this case study

Decision-Grade Measurement

A Number You Can Act On.

FarmOptima is building the measurement-and-decision layer for smallholder agriculture — starting where the data is hardest and the value is clearest. We'll walk you through how the same discipline applies to your catchment, portfolio, or programme.

>2.5×
Correction Applied
Full Season
Radar + Optical Coverage
95%
Confidence Bounds Stated
1 Catchment
To Region, By Design