Pilot Result · Silchar, Assam · 2025–26

Precision Farming
at Scale
Proven on Rajma

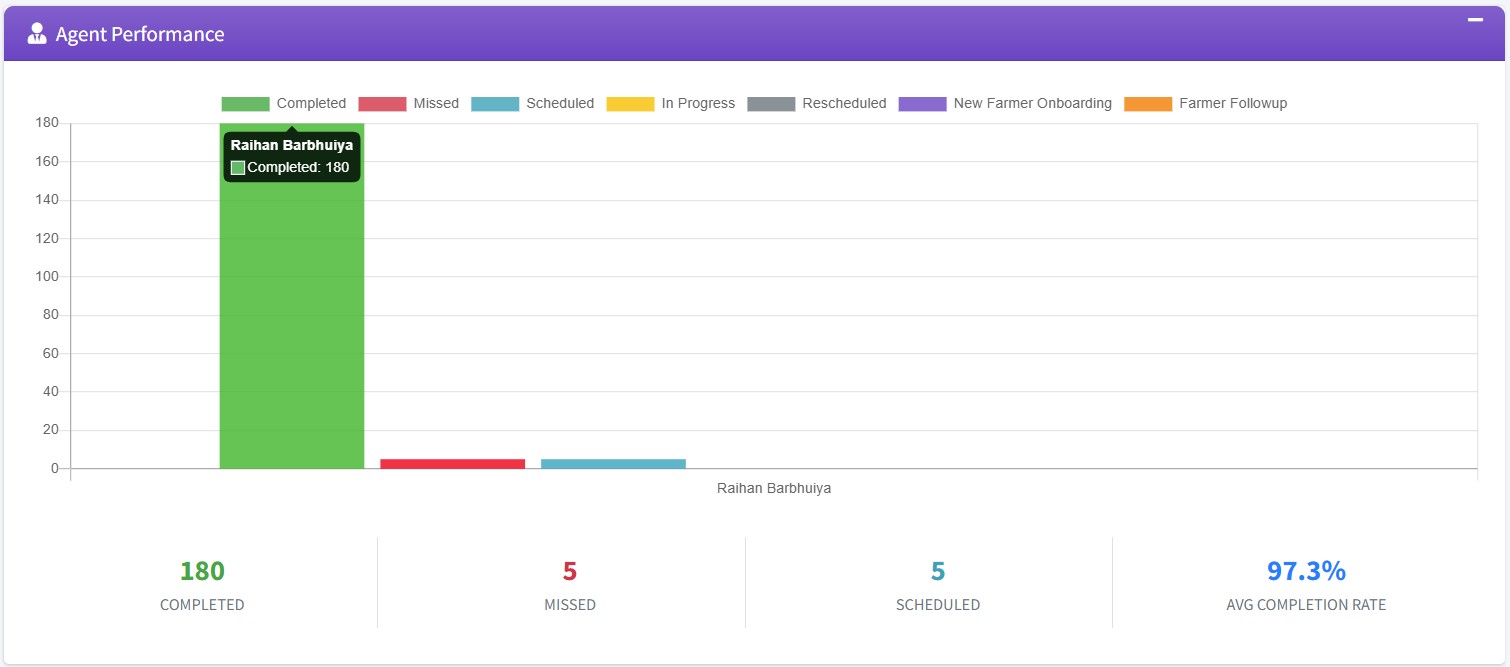
FarmOptima deployed across 27 smallholder farms in Cachar District — 62 field visits, 35 crop health analyses, 184 total agent activity events, and zero missed appointments across one Rabi season.
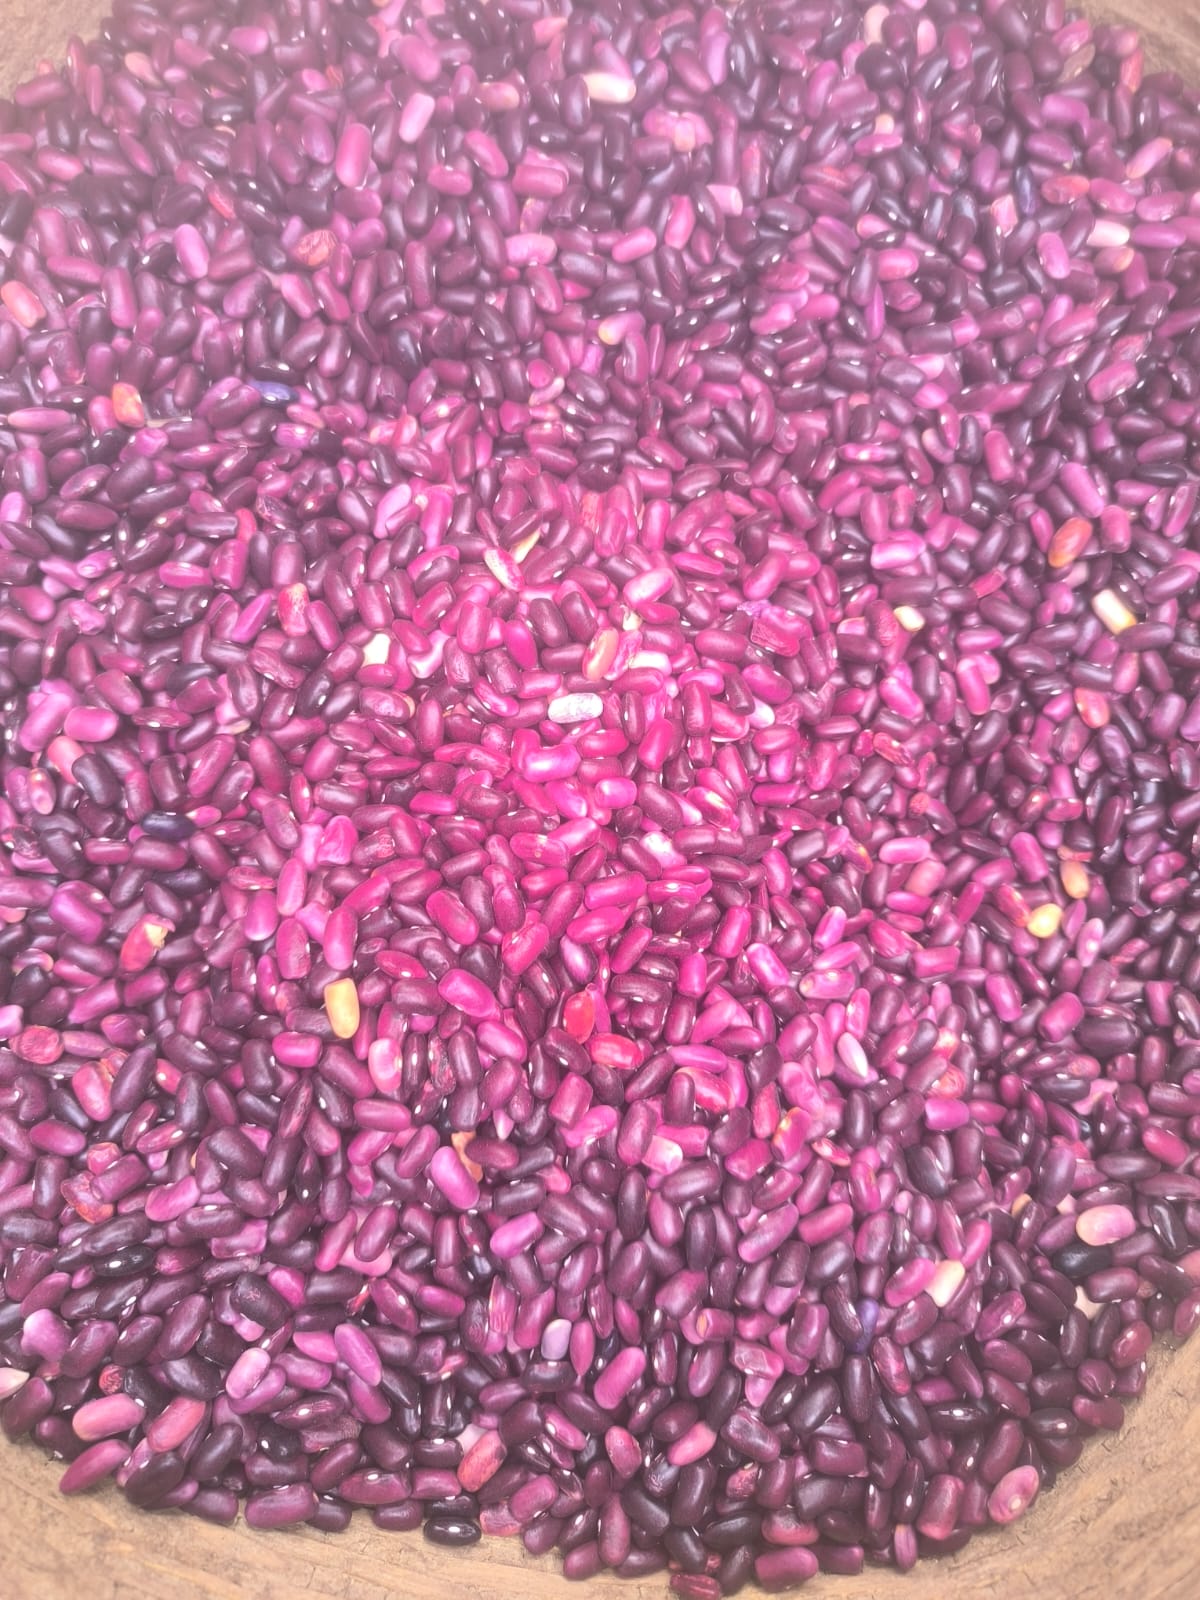
Farmers27 Enrolled
Land Area45 Bighas
CropKidney Beans (Rajma)
LocationSilchar, Assam
Rajma harvest Silchar 2025
POST-HARVEST YIELD ↑ 28% vs. Baseline
Outcome 01 · Yield
+28%
Increase in yield per bigha vs. district baseline
↑ 3.2 → 4.1 qtl/bigha
Outcome 02 · Income
₹4,200
Additional net income per farmer per season
↑ per household gain
Outcome 03 · Inputs
−18%
Reduction in fertiliser & pesticide spend
↓ ~₹1,800 saved/farmer
The Opportunity

A Replicable Model for
Agricultural Clusters

This pilot established the FarmOptima Agripreneur model as a deployable playbook — one trained agent, one cluster of 100 farmers, one platform connecting satellite data to farm-level action.

❗ The Problem We Solved

Rajma farmers in Cachar District had no structured access to crop science. Fertiliser decisions were anecdotal. Pest identification was guesswork. There was no mechanism to translate satellite imagery into actionable farm-level guidance — until FarmOptima.

⚙️ How FarmOptima Works

One Agripreneur — trained and certified by Farm United — manages a cluster of up to 100 farmers using the FarmOptima mobile app. The AI advisory engine processes soil data against ICAR PoP guidelines. Sentinel-2 satellite tracks crop health weekly. All outputs delivered via WhatsApp.

📐

Built for National Scale — Not a One-Off

This 27-farmer pilot is proof of concept for the FarmOptima Agripreneur model. Each trained Agripreneur can serve up to 100 farmers — making the unit replicable across any state in India. One corporate partner, one deployment decision, measurable outcomes from the first season.


Impact Metrics

Three Measurable Outcomes,
One Growing Season

All outcomes benchmarked against Assam Agricultural Department district-level baseline data for Rajma in Cachar District.

🌾
+28%
Yield Increase vs. Baseline
Timely soil-specific fertilisation and early stress detection via satellite pushed average output from 3.2 to 4.1 qtl/bigha across all enrolled plots.
Baseline: 3.2 qtl/bigha → Pilot: 4.1 qtl/bigha
💰
₹4,200
Income Improvement per Farmer
Higher yield, better produce quality, and reduced wastage translated into meaningful net income gains per household over a single Rabi season.
Avg. farm: ~1.7 bighas · Season: Rabi 2025–26
🧪
−18%
Input Cost Savings
AI advisories eliminated unnecessary pesticide applications and optimised fertiliser dosage per soil profile — reducing average input spend ~₹1,800 per farmer with no yield trade-off.
Avg. input spend: ₹9,800 → ₹8,000

Platform Operations

What the Data Looks Like
Inside FarmOptima

Every advisory, visit, scan, and farmer interaction is logged and visible to corporate administrators in real time through the FarmOptima dashboard.

Agent Activity and Advisories Dashboard
Agent Activity Breakdown — All Functions
184 total agent activity events logged across 6 tracked functions. Field visits led at 62, followed by 35 crop health analyses, 27 farmer calls, 27 plots mapped, 21 alerts, and 12 crop scans.
62 Field Visits35 Crop Health27 Farmer Calls21 Alerts184 Total
Agent Performance Dashboard
Agent Performance — Raihan Barbhuiya
62 field visits completed with 0 missed. 27 plots fully mapped. Corporate administrators can track every agent's performance with drill-down per visit type, date, and farmer — from any device.
62 Visits · 0 Missed27 Plots MappedReal-time
35
Crop Health Analyses
62
Field Visits
27
Farmer Calls
184
Total Activity Events
Agent Activity Breakdown — Raihan Barbhuiya
RABI 2025–26
Activity
Count
Share
🚜 Field Visits
62
34%
🌱 Crop Health Analysis
35
19%
📞 Farmer Followup Calls
27
15%
🗺️ Plots Mapped
27
15%
🔔 Farmer Alerts Shared
21
11%
📸 Crop Scans Shared
12
6%
All activities logged in real time via the FarmOptima mobile app 184 total events
For Corporate Partners

From 27 Farmers to
Any Scale, Any State

FarmOptima scales linearly — one Agripreneur serves 100 farmers. Add agents, retain full data visibility. No new infrastructure. Deployable in any state in India.

1 Agripreneur
The Base Unit
1 trained Agripreneur serves up to 100 farmers — covering soil advisory, satellite monitoring, field visits, WhatsApp alerts, and marketplace facilitation. Proven in this pilot with 27 farmers.
10 Agripreneurs
District Cluster
1,000 farmers across a district. Unified admin dashboard, cross-cluster analytics, and consolidated procurement data — all visible in real time to the corporate partner.
50+ Agripreneurs
State-Scale Deployment
5,000+ farmers, multi-crop, multi-district. API integration with corporate ERP and procurement systems. Traceability, quality scoring, and a direct farmer marketplace — at any scale, in any state.
🇮🇳

Deployable Across Any State in India

Same platform. Same training protocol. Same outcomes. Different geography.

India has 146 million smallholder farm households. The FarmOptima Agripreneur model is designed to reach them at scale — without building new infrastructure. A corporate partner deploying 50 Agripreneurs reaches 5,000 farmers in season one, with each cluster generating advisory, satellite, marketplace, and traceability data visible through a single dashboard.

The model is state-agnostic. Whether your supply chain anchors in Assam, Punjab, Maharashtra, or Odisha — the same playbook applies. One Agripreneur. One hundred farmers. Full visibility.

✓ Assam — Live West Bengal Odisha Bihar Jharkhand Punjab Maharashtra Madhya Pradesh + Any State
1 Agripreneur 100 farmers
10 Agripreneurs 1,000 farmers
50 Agripreneurs 5,000 farmers
500 Agripreneurs 50,000 farmers
India's potential 146M households
Agripreneur Spotlight
Raihan Barbhuiya
FarmOptima Agripreneur · Silchar Kendra · Farm United Certified

Raihan represents the FarmOptima model in its purest form — a locally embedded, trained agricultural entrepreneur bridging AI-generated insights and farm-level reality. In this pilot, he completed 62 field visits with zero missed appointments, conducted 35 crop health analyses, made 27 farmer followup calls, shared 21 farmer alerts and 12 crop scans via WhatsApp, and fully mapped all 27 plots — maintaining real-time data entry throughout the season.

62
Field Visits
184
Total Events
Program Execution

Season Timeline

Phase 1 · Pre-Season
Farmer Onboarding & Soil Profiling
27 farmers enrolled via FarmOptima. Farm boundaries digitised as geo-polygons. Soil parameters collected and processed against ICAR Package of Practice guidelines for Rajma. Baseline yield data recorded per farmer.
Phase 2 · Establishment
Satellite Monitoring Activated
Sentinel-2 satellite coverage enabled across all 45 bighas. Weekly NDVI crop health scores computed and pushed to agent and farmers via WhatsApp. Early stress signals flagged in 3 plots, enabling pre-emptive intervention.
Phase 3 · Active Growth
AI Advisories & Field Visits
35 crop health analyses conducted and shared with farmers via WhatsApp. 62 field visits completed with zero missed. 21 farmer alerts pushed for weather and pest events. 12 crop scans shared, 27 followup calls logged — all tracked in real time on the FarmOptima dashboard.
Phase 4 · Post-Harvest
Yield Documentation & Impact Audit
Post-harvest yield data collected from all 27 farmers and compared to district baseline. Income and input cost data reconciled. Outcomes packaged into replication playbook for corporate partner reporting.

Share this case study

Deploy Anywhere in India

1 Agripreneur.
100 Farmers. Any State.

We'll walk you through exactly how a rollout works in your geography — from first Agripreneur cluster to full state coverage, with complete admin visibility and procurement connectivity from day one.

100
Farmers / Agent
+28%
Yield Uplift
₹4,200
Income/Farmer
1 Season
To Results